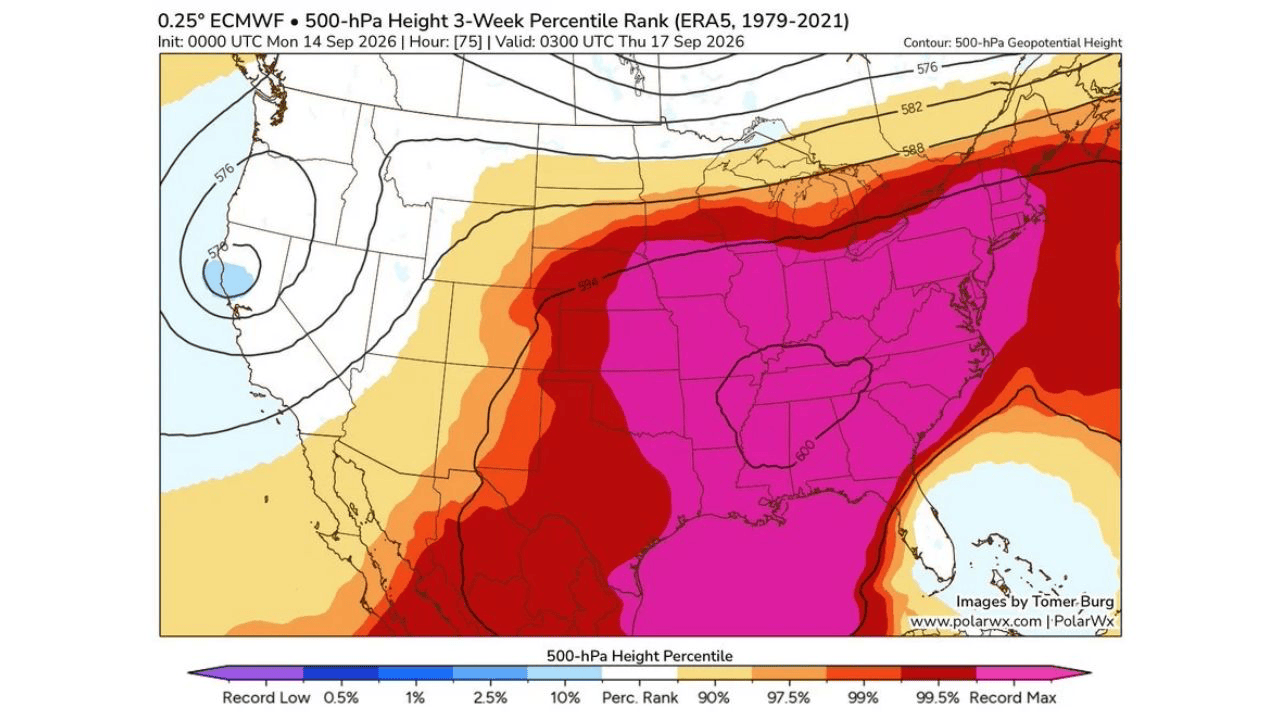
DES MOINES, IOWA — An extraordinarily amplified upper-level ridge is settling over more than half of the Lower 48 this week, driving 500-millibar heights to record-max territory across a massive swath of the country stretching from the central Plains through the Ohio Valley, Southeast and up into the Mid-Atlantic. The pattern, initialized at 0000 UTC Monday, September 14, and valid through 0300 UTC Thursday, September 17, according to ECMWF model data, shows large sections of the eastern half of the nation sitting at or above the 99.5th percentile for this point in the calendar going back to 1979. For the Soybean Belt, the ridge is translating directly into an exceptionally warm final stretch of the growing season, with temperatures tracking 8.4 degrees Fahrenheit above normal through September 21.
Record-Setting 500-Millibar Heights Sprawl Across More Than Half the Lower 48
Meteorologists describing the setup called it an absolutely insane pattern for mid-September, with more than half of the Lower 48 expected to see record maximum 500-millibar height percentiles at some point this week. The ECMWF three-week percentile rank analysis, benchmarked against ERA5 reanalysis data from 1979 to 2021, shows a continuous band of record-max readingsrunning from the central and southern Plains through Missouri, Illinois, Indiana, Kentuckyand the Ohio Valley, then fanning out across the Deep South, Southeast and much of the Mid-Atlantic coastline. Even areas that fall just short of record territory are still sitting in the 97.5th to 99th percentile, meaning the ridge’s reach extends well beyond its magenta-shaded core.
Ridge Peaks Thursday With Core Heights Near 600 Decameters Over the Ohio Valley
The strongest signal on the map centers on a closed contour of roughly 600 decametershovering over the Illinois-Indiana-Ohio Valley corridor, valid Thursday, September 17, with surrounding contour lines of 594, 588 and 582 decameters stair-stepping outward across the Plains, Southeast and Northeast. Heights of that magnitude are more typical of peak summer than the third week of September, underscoring how far outside the historical range this week’s pattern is running. West of the Rockies, by contrast, the pattern flips, with a closed low and below-normal heights parked off the Pacific Northwest coast, keeping that region on the cool side while the East bakes under the ridge.

Soybean Belt Running 8.4 Degrees Above Normal Through September 21
For agricultural forecasters, the headline number out of this pattern is the 8.4-degree Fahrenheit average temperature departure projected for the Soybean Belt through September 21. Late-September heat and dryness has historically been associated with lower soybean yields, since the crop is still finishing its grain-fill stage and extra heat stress late in the season can trim bushel counts even without a severe drought. What sets 2026 apart, forecasters note, is the sheer magnitude of the anomaly, with this year’s projected departure running well outside the range of prior late-summer heat spikes over the Corn and Soybean Belt.
Near-Normal Rainfall Limits the Yield Hit to Just 0.3 Bushels Per Acre
Despite the historic heat, a seasonal-conditions-versus-yield analysis for the September 1 to September 21 window shows 2026 landing in a Mixed season category rather than a clear-cut drought signal. Precipitation anomaly for the period is running plus 0.26 inches, essentially near normal, which is cushioning the blow from the 8.4-degree heat anomaly. The current-year data point sits at the hot edge of the scatter distribution alongside other above-average-yield years, rather than clustering with the sharply below-trend years that combined heat with significant dryness. As a result, the current estimated yield departure is just -0.3 bushels per acre, with the 2026 estimate at 52.2 bushels per acre against a trend line of 52.5 bushels per acre.
How 2026 Compares to Past Hot Summers for Soybean Growers
Historical seasons plotted on the same temperature-versus-precipitation chart show a clear pattern: years that combined significant heat with below-normal precipitation tend to carry the largest below-trend yield departures, while years with near-normal or above-normal rainfall alongside heat have historically held yields closer to trend, even when temperatures spiked. 2026’s position, with record or near-record heat paired with essentially normal rainfall, helps explain why this year’s yield impact, while still negative, remains modest relative to the extremity of the temperature anomaly. Growers and analysts will be watching whether the record-high 500-millibar heights persist beyond Thursday, September 17, and whether rainfall totals hold near normal through the rest of the month, as any shift toward drier conditions on top of the existing heat could push the yield departure further below trend.


